Articles & Insights
Part reflection, part curiosity, part “I can’t believe no one’s talking about this.”
That mid-workout wall training fasted is your body switching to fat. Do not quit five minutes before it clicks. How to build it.
You did not fail and you did not gain it all back. A slip is a choice, not a collapse. Here is how to get straight back on.
A weekly long fast can be sustainable, with recovery. The one signal it is too much: a plateau that arrives with feeling worn down.
Most people assume the real battle is physical. It isn’t. Once you can already do a one-meal day, the bigger obstacles are the mental noise, the social friction, and knowing the difference between ordinary resistance and a genuine stop signal.
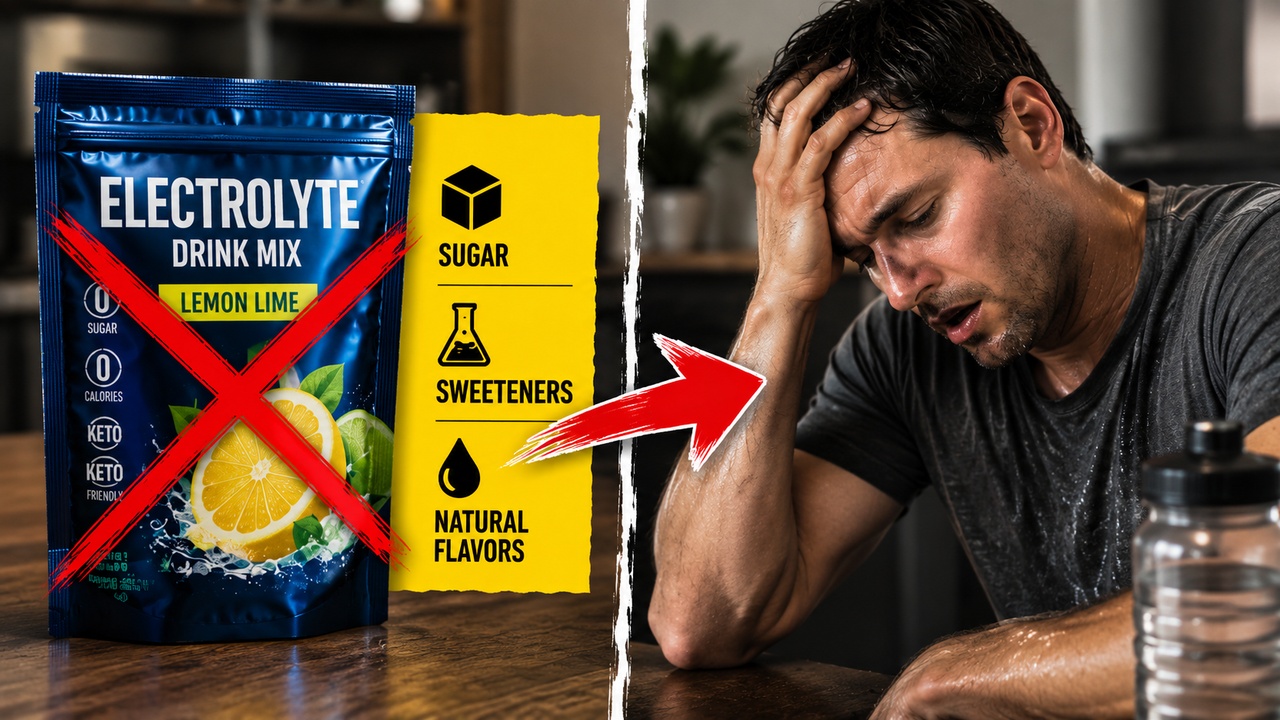
It is the additives that break a fast, not the minerals. What you actually need, and why potassium is the one everyone forgets.
Your app's protein target is likely inflated. Anchor it to your ideal body weight, take a weekly average, and the panic goes away.