

"I'm always so tired after eating."
Not random tiredness. A signal sitting in your last lipid panel.
That kind of post-meal exhaustion — the heavy-eyelid feeling an hour after lunch, the afternoon energy collapse, the urge to lie down after dinner — gets written off as "just being a grown-up" or "I ate too much." Most of the time it's neither. It's your body telling you something specific about how it's handling food.
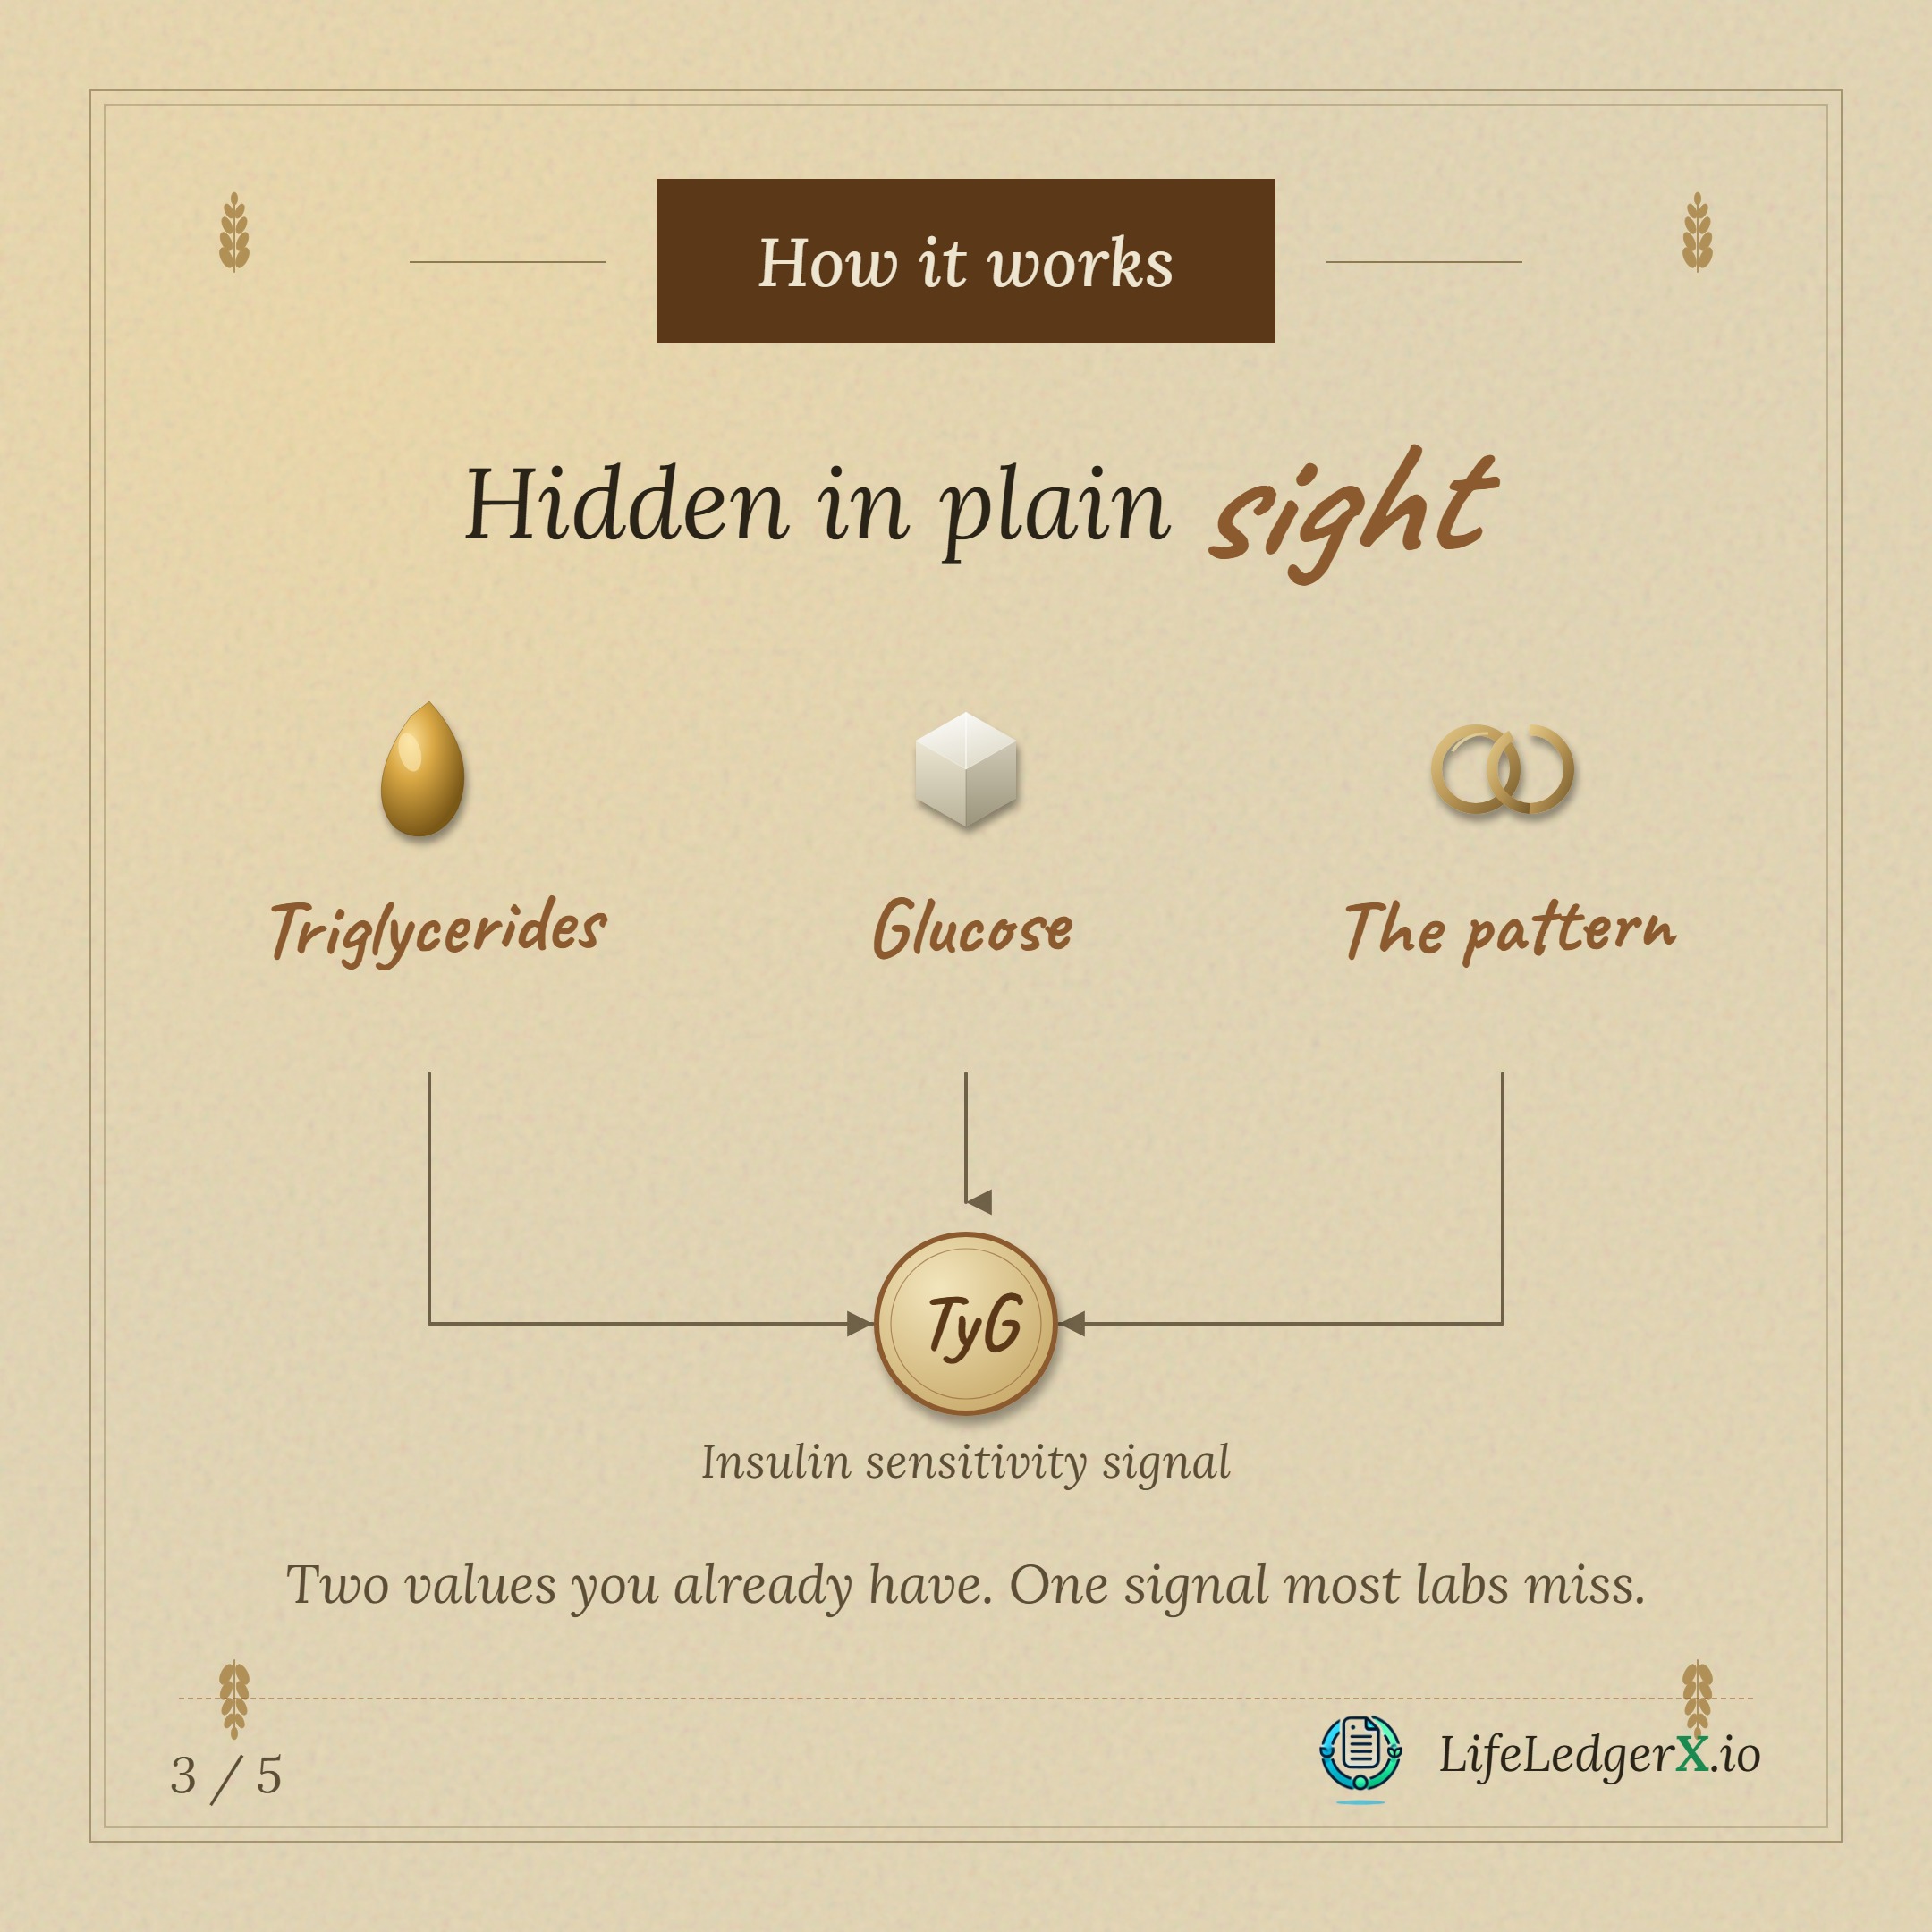
Hidden in plain sight
Two values you already have. One signal most labs miss.
When you get a standard blood panel done, two numbers in the report carry a story together that neither tells alone:
- Triglycerides — the fat your body is moving around after meals.
- Glucose — your blood sugar at the moment the blood was drawn.
Multiplied together — and log-transformed so the math behaves — you get the TyG index, a single number that proxies how sensitive your body is to insulin. Both values print on every standard lipid panel. Labs don't combine them. So the signal sits in your records, just never extracted.
The gold-standard test for insulin sensitivity is HOMA-IR, which needs a separate fasting-insulin draw that most regular panels skip. The TyG index gets you most of the way there using values your last bloodwork already gave you. No new test, no new draw — just the math on what's already on the page.
How the body is signaling
When insulin sensitivity is strong, your cells take up glucose efficiently after a meal. Energy goes where it should — muscles, brain, working tissue. You feel pleasantly fed, not flattened.
When insulin sensitivity drops, glucose lingers in the bloodstream. Your pancreas pushes more insulin to compensate. The combination triggers fat storage, water retention, and — relevant to the hook — a real fatigue response. That's the "always tired after eating" pattern. The 3 p.m. crash. The post-dinner couch gravity.
Triglycerides going up alongside glucose is the second half of the signal. It means your liver is sending fats into circulation faster than tissues can pick them up — which happens more readily when insulin signaling is impaired.
Two values, one read, quietly precise.
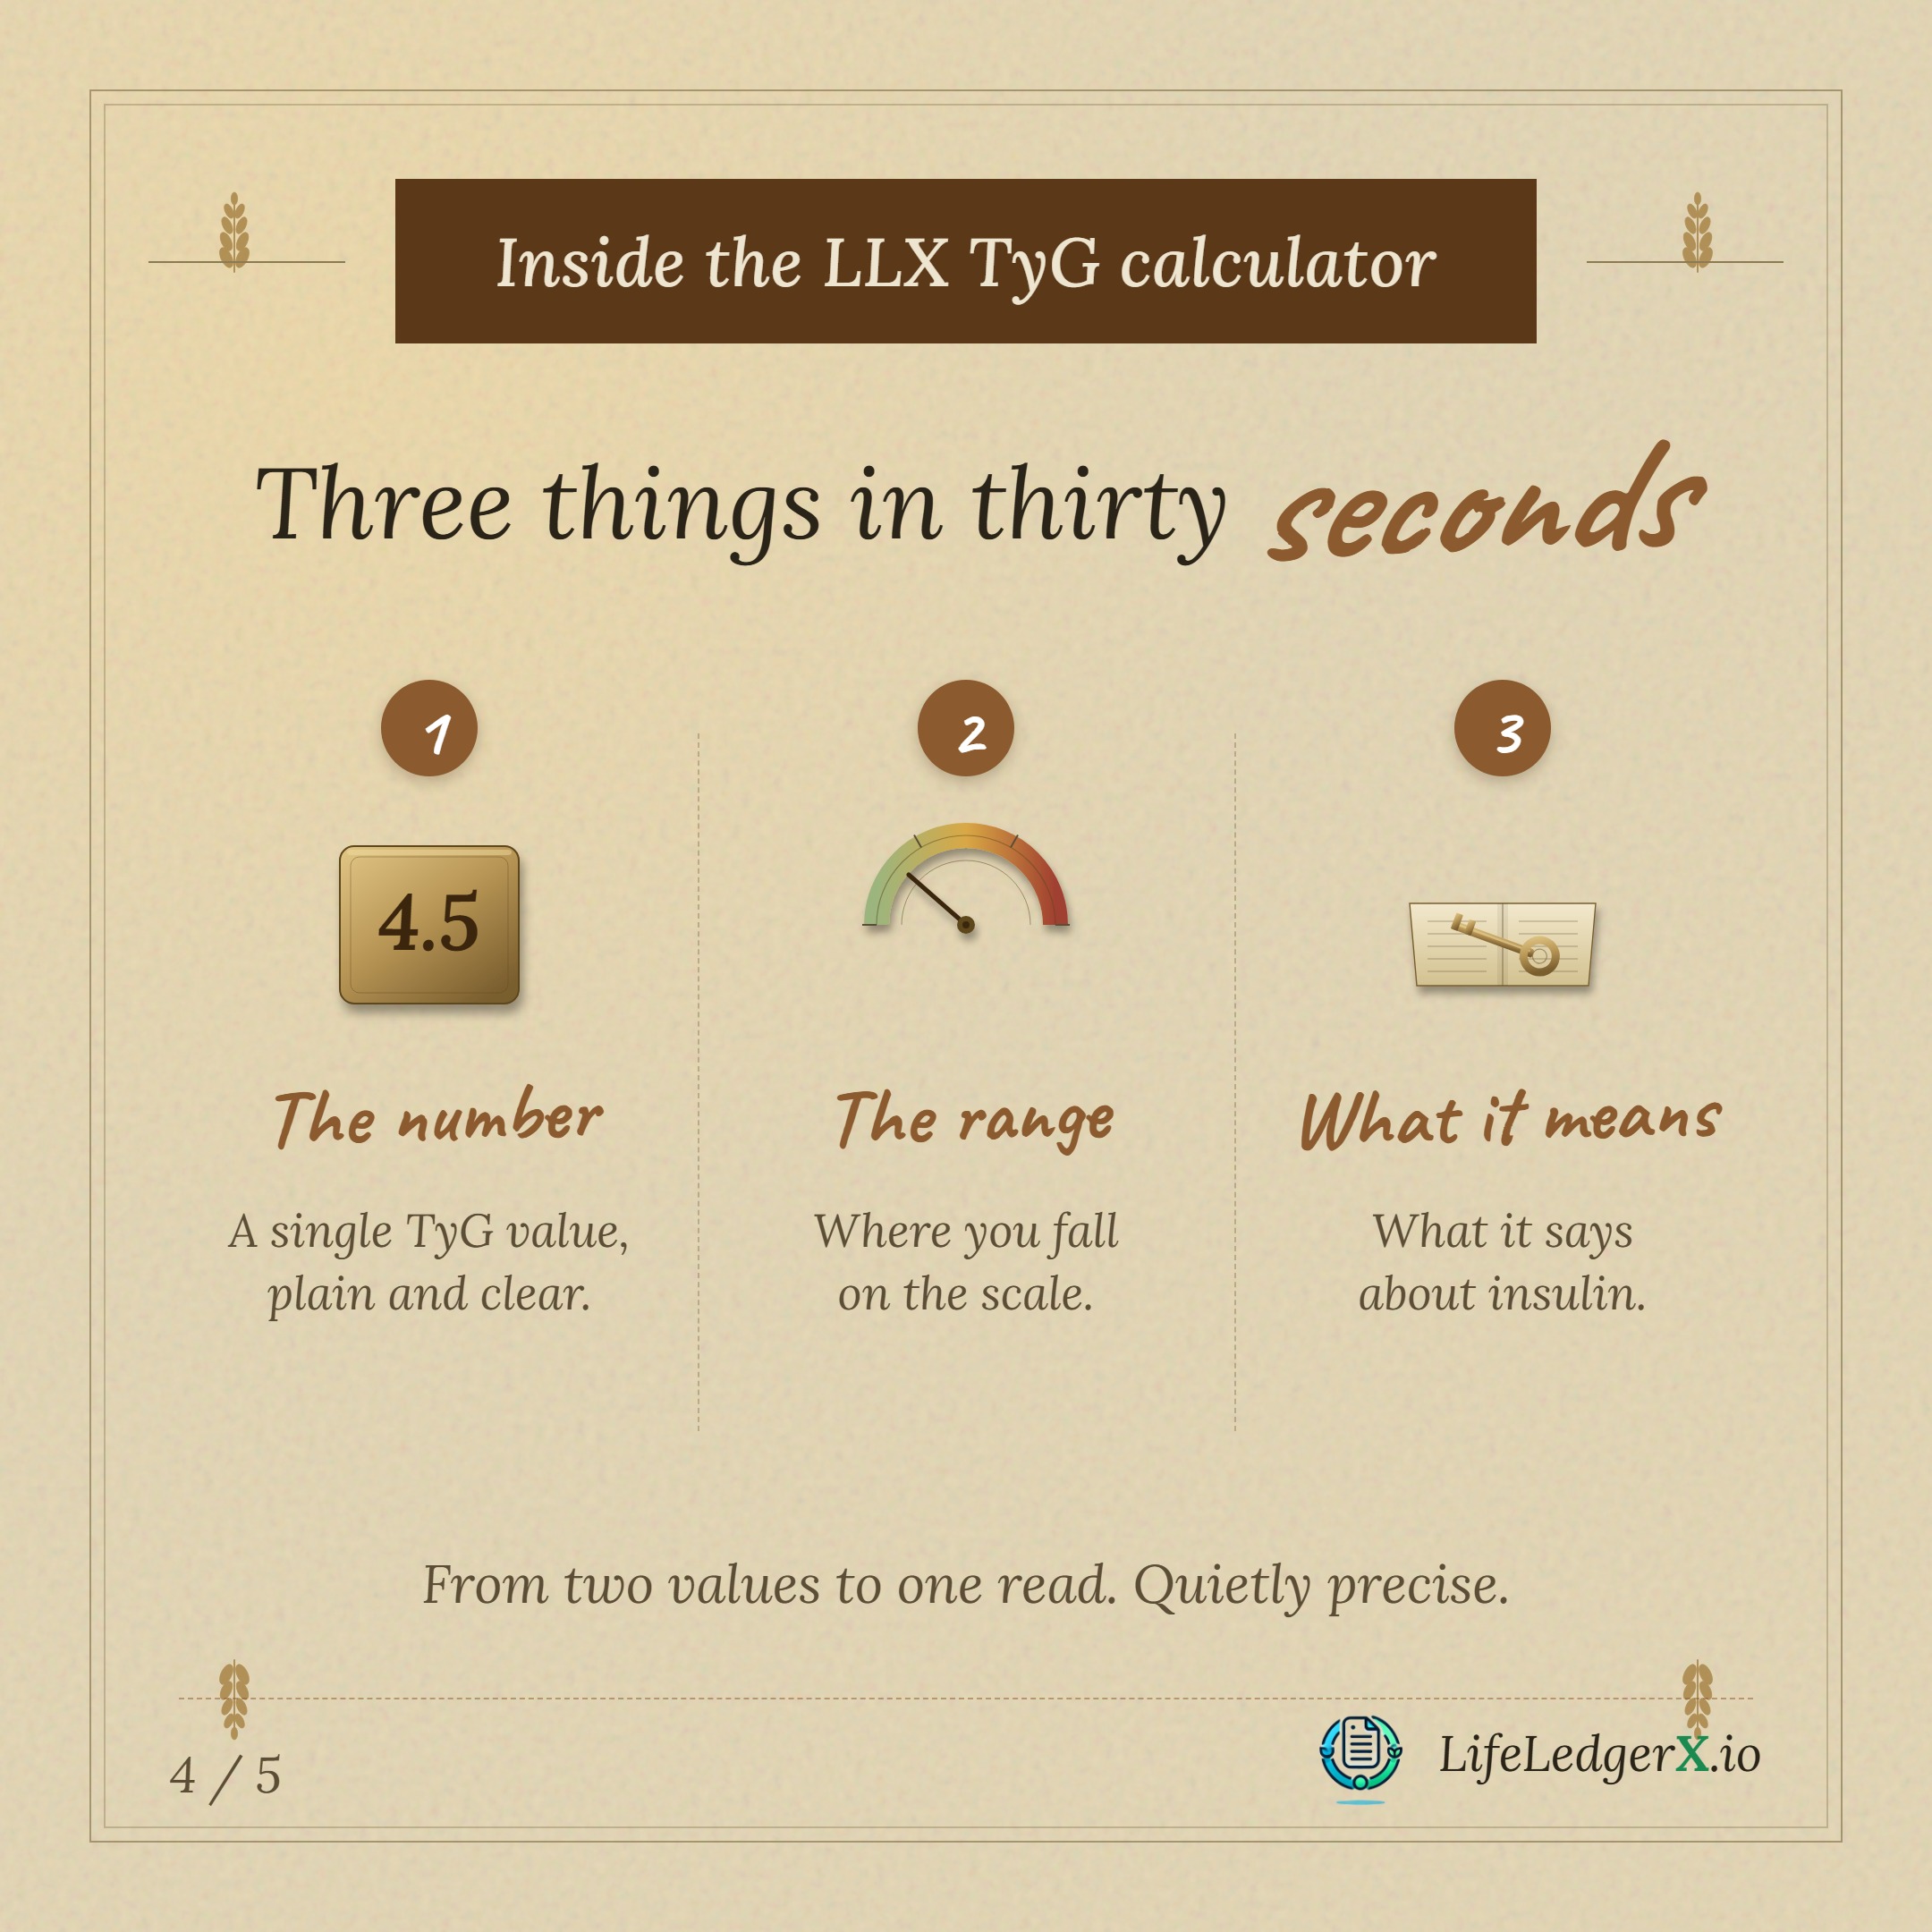
Inside the LLX TyG calculator
Three things in thirty seconds.
- The number — a single TyG value, plain and clear. Plug in your last triglycerides and fasting glucose readings, get one number.
- The range — where you fall on the scale. Below ~4.55 is typical insulin-sensitive territory; above starts pointing toward insulin resistance worth investigating.
- What it means — what your specific number says about insulin handling, in plain language.
From two values to one read.
What to do with it
A high TyG isn't a diagnosis. It's a question worth asking your doctor about — and a number worth tracking over time. The levers with the most leverage, in order:
- Post-meal walks. Ten to fifteen minutes after lunch and dinner moves glucose into muscle without insulin doing the work. Direct, measurable improvement in TyG over weeks.
- Sleep consistency. Even one night of short sleep degrades insulin sensitivity for 24-72 hours. The recovery is faster than the damage — one good night helps, and a steady rhythm helps more.
- Carb-protein-fat ordering. Eating fiber and protein before the starchy part of a meal flattens the glucose spike. Same food, different order, lower TyG signal over time.
The number isn't the goal. The number is a way to know whether the changes you're making are doing what you think they're doing.
Run yours
Run your TyG number against your last bloodwork.
→ lifeledgerx.io/tools/insulin-metabolic-risk/tyg-calculator
By Foster